

Dashboard vs the Analytics page
The app gives you two views of the same underlying data:- Dashboard (Home) — a quick daily health check: metric cards for Active Campaigns, Total Usage (applications, with a 7-day trend), Total Revenue (with the refunded amount shown alongside), and Conversion Rate (with total discounts given). Below the cards you get a Revenue Trend chart (Revenue + Refunds), a Campaign Distribution donut grouped by status, a Needs Attention list, Top Performers (your top 3 campaigns by revenue), Recent Campaigns, and a plan usage card. If your shop is on the Free plan and has hit its monthly cap, a usage-paused banner appears here.
- Analytics page — the deep-dive view with a longer time range, more charts, a per-campaign performance table, and CSV export.
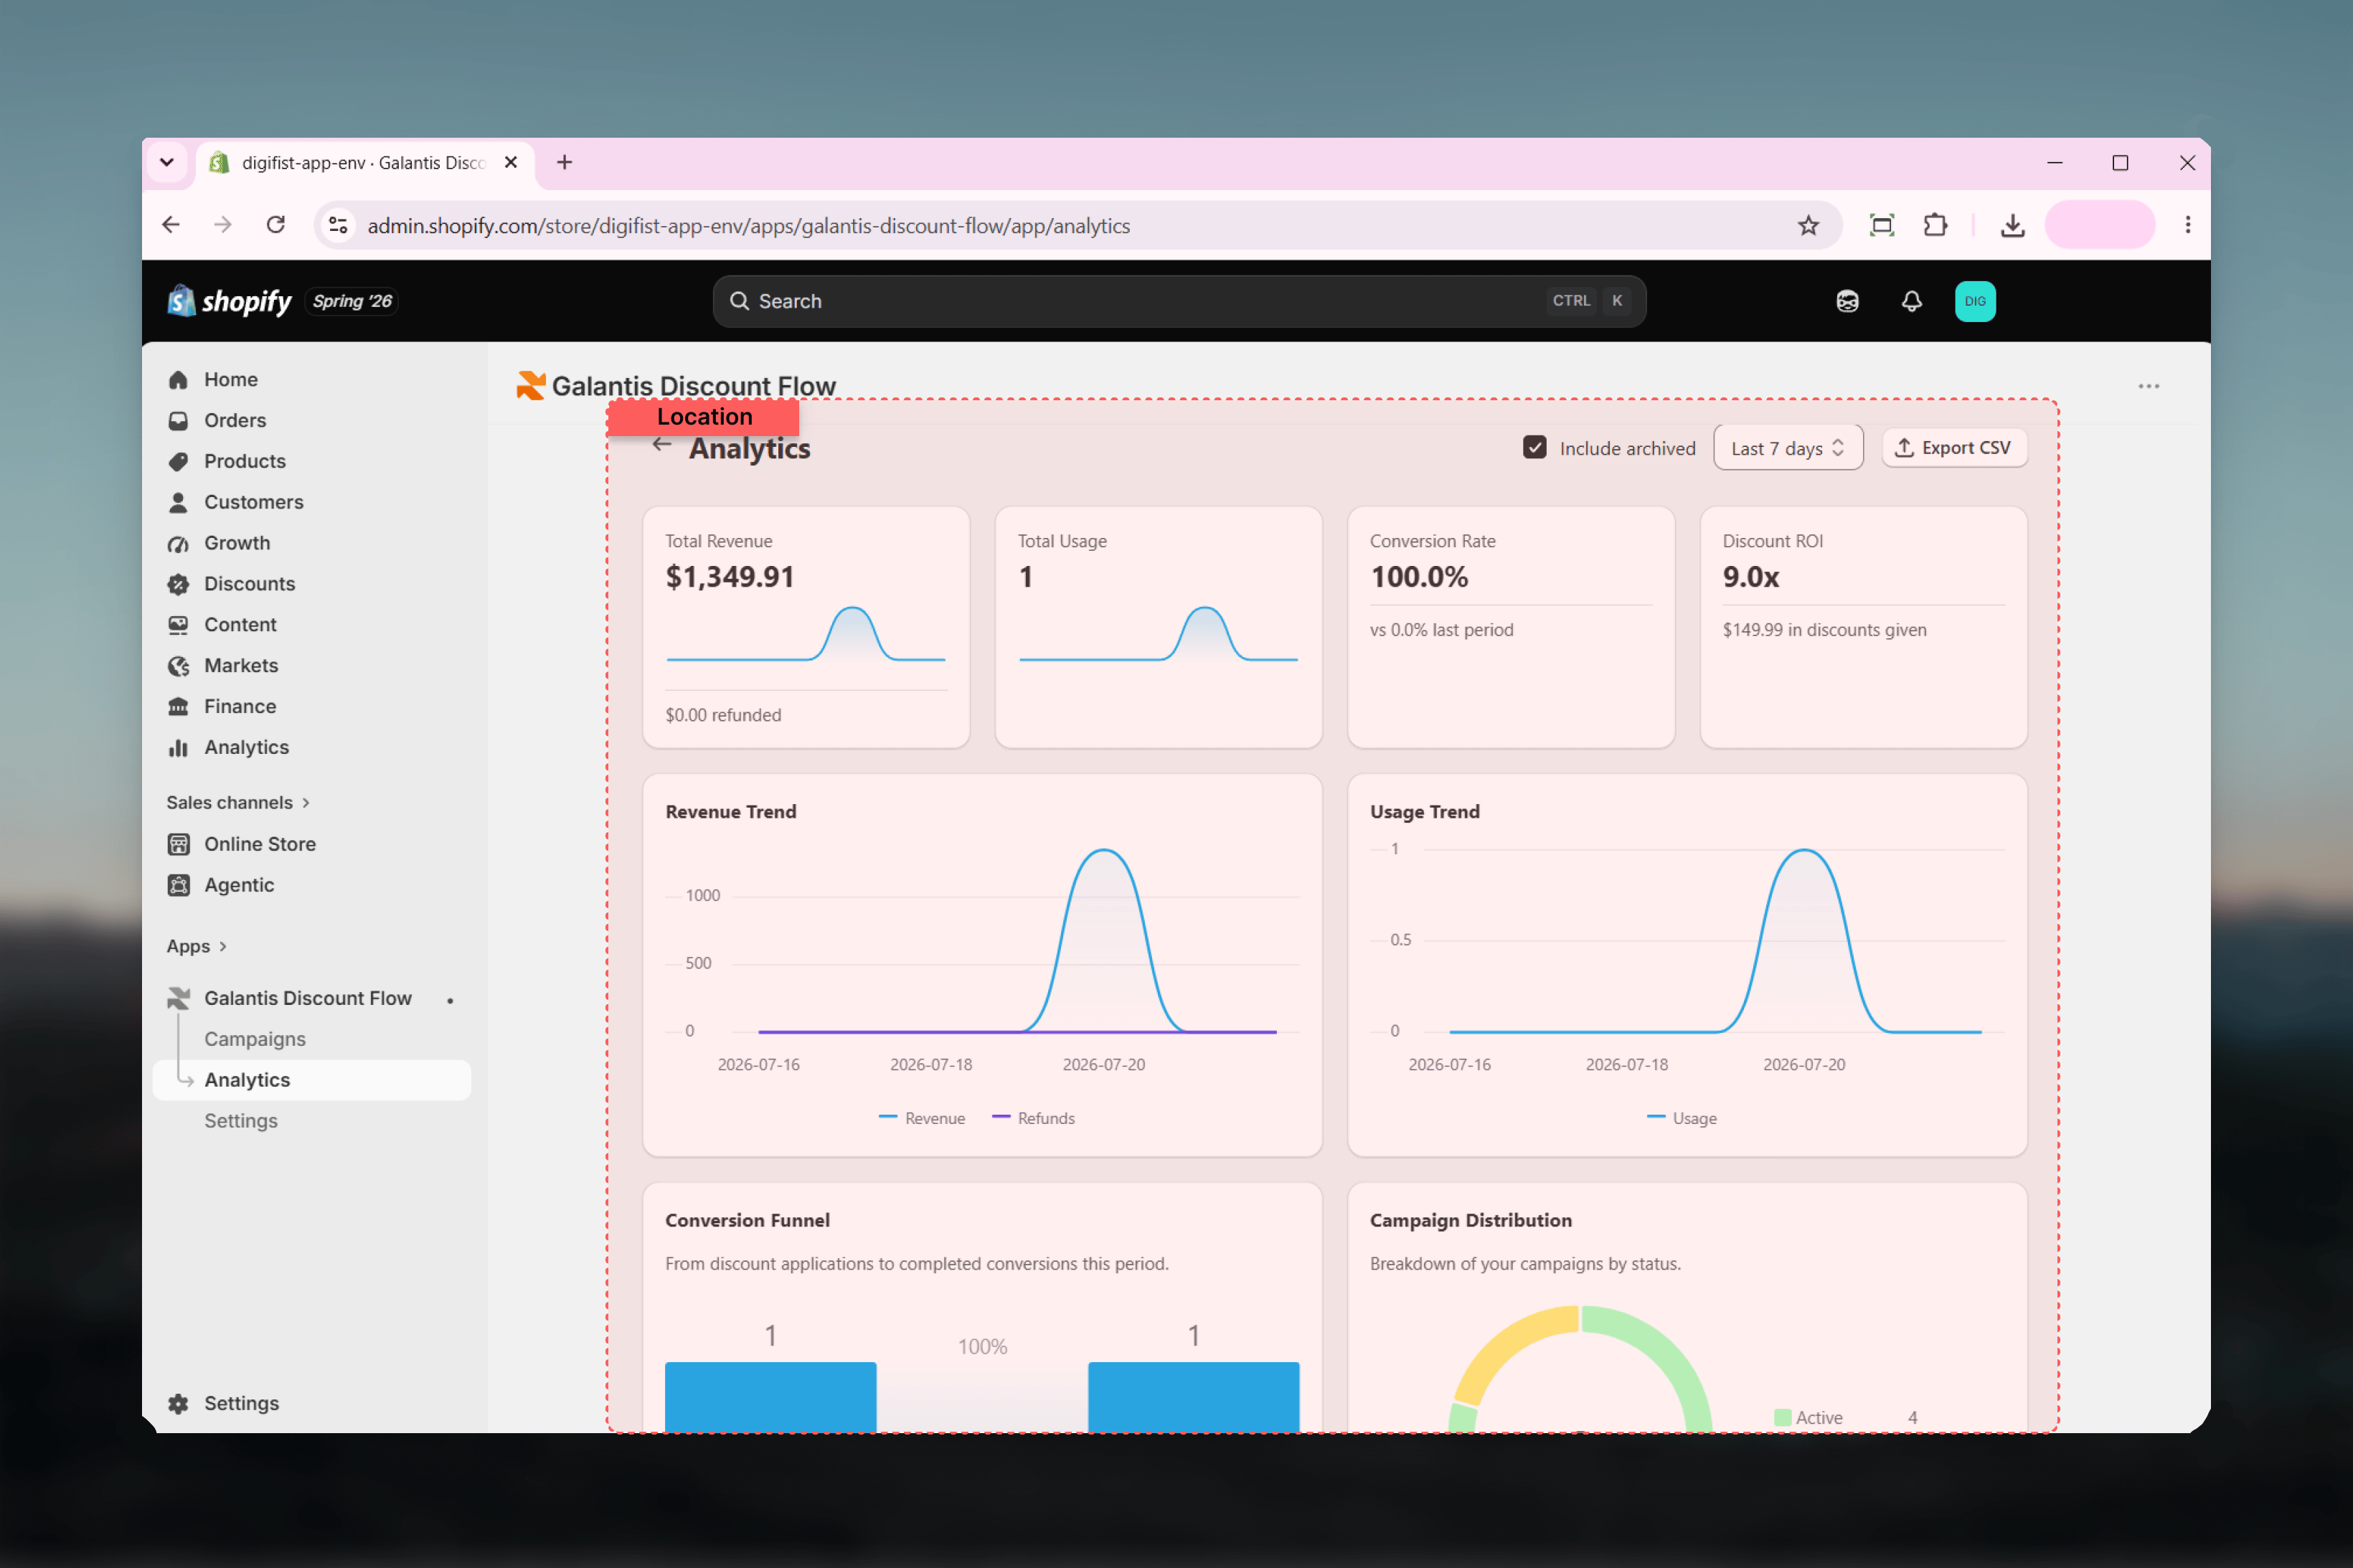
Analytics page controls
Three controls at the top of the Analytics page shape everything below them:Every metric, defined
Galantis Discount Flow records a small set of events per campaign and derives everything else from them:Free-shipping-only campaigns don’t report revenue columns, since the discount applies to delivery rather than product prices.
All money metrics are reported in your store currency, converted by Shopify. This includes orders placed in other checkout currencies and campaigns that use per-currency amounts — there is no per-currency breakdown.
Charts
The Analytics page includes five visualizations for the selected period:- Revenue Trend — revenue and refunds over time, plotted together.
- Usage Trend — discount applications over time.
- Conversion Funnel — impressions → applications → conversions, showing where customers drop off.
- Campaign Distribution — campaigns grouped by status.
- Top Performers — your highest-revenue campaigns.
Campaign Performance table
The table at the bottom breaks results down per campaign with columns for Campaign, Usage, Conv. Rate, Revenue, Discount, Refunded, and ROI. Use it together with Include archived to compare retired campaigns against active ones.How attribution and refunds work
Orders are attributed back to the campaign automatically — you don’t have to tag anything:1
The discount carries a marker
Every published campaign embeds an invisible marker in its Shopify discount. For code-based campaigns, the discount code itself identifies the campaign.
2
Shopify webhooks report the order
When an order is created and paid, Shopify notifies Galantis Discount Flow, which matches the marker (or code) to the campaign and records a conversion, the revenue, and the discount amount given.
3
Refunds and cancellations flow back
When a refund is created or an order is cancelled, the attributed revenue is reduced and the refunded amount is shown separately — on the Total Revenue card, in the Revenue Trend chart, and in the Refunded column of the performance table.
Exporting data
Click Export CSV on the Analytics page to download the data for the currently selected Period (and archived campaigns, if Include archived is checked). The export mirrors what you see on screen, so set your filters first.Related guides
- How discounts apply at checkout — where applications and conversions actually happen
- Plans & limits — how Free-plan usage caps relate to the numbers you see here
- Troubleshooting — what to check when numbers look off